
How to Set Up a Chart of Accounts in Canada: Best Practices
Setting up a chart of accounts forms the backbone of your organization's financial management system in Canada — whether you run a small business, registered charity, or nonprofit corporation. With CRA's continued push toward digital record-keeping, having a well-structured chart of accounts is more important than ever.
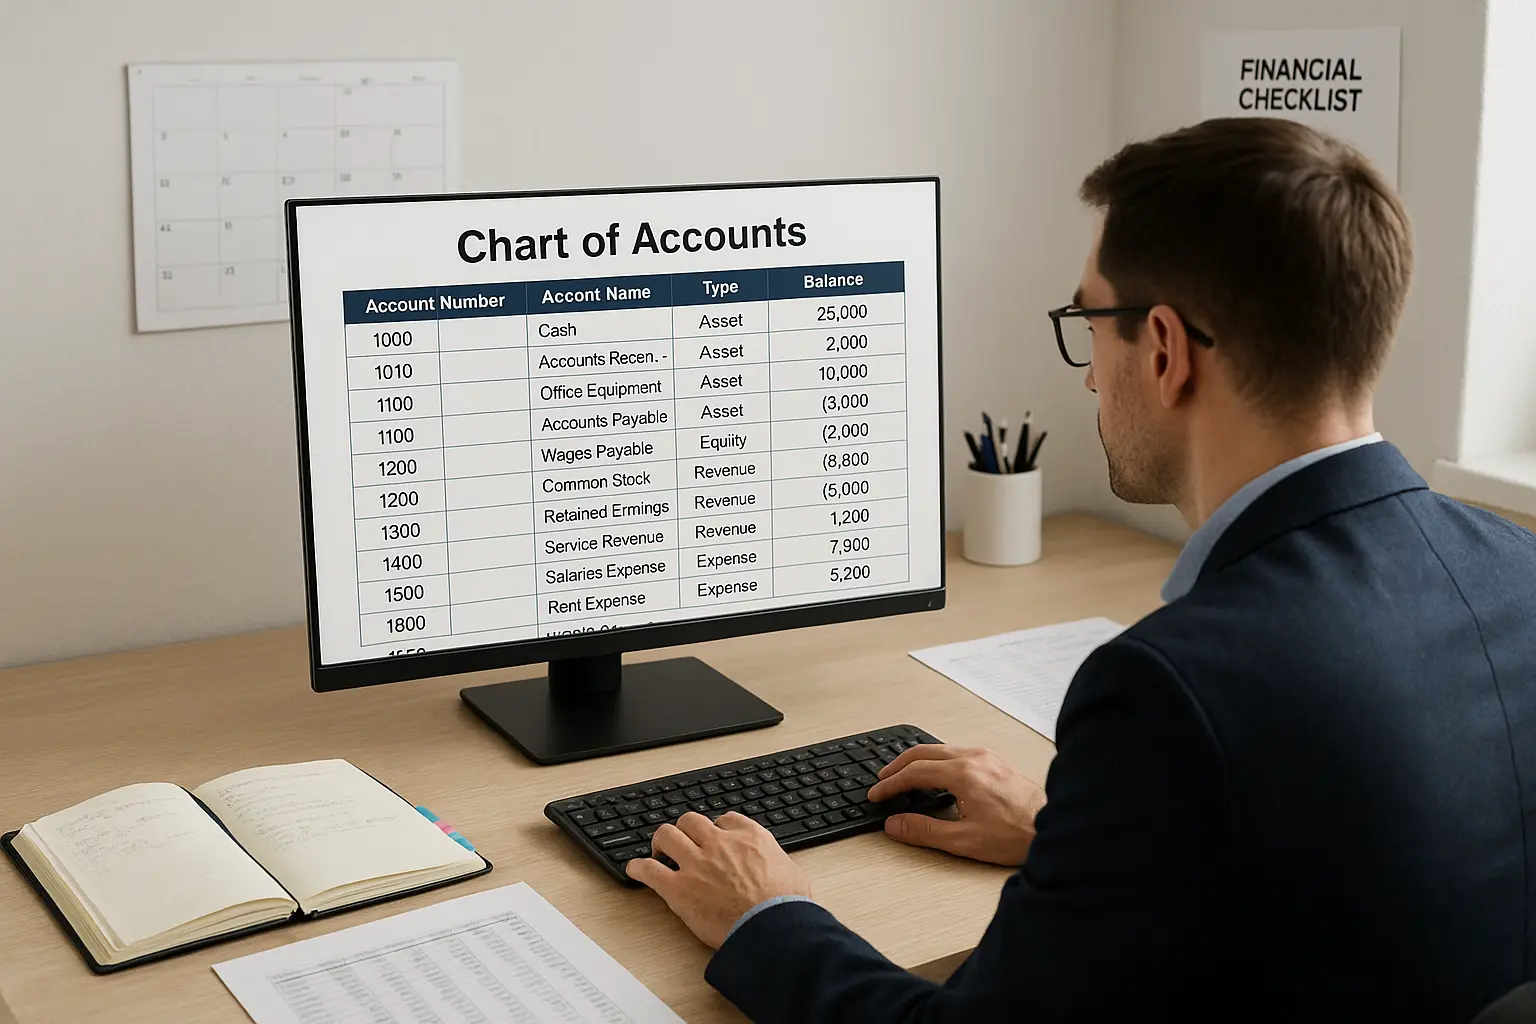
A properly organized chart of accounts includes five main categories — assets, liabilities, equity, revenue, and expenses — with numbered subcategories that reflect your specific business needs and Canadian accounting standards.
We'll walk you through the entire process of creating a chart of accounts that works for Canadian businesses and nonprofits. You'll learn how to choose the right account categories, set up a logical numbering system, and avoid common mistakes that can cause problems later. We'll also cover the specific requirements for registered charities and share proven strategies to keep your chart of accounts clean and useful as your organization grows.
Understanding the Chart of Accounts in Canada
A chart of accounts organizes all financial transactions into specific categories for Canadian businesses.
This system connects directly to your financial statements and ensures compliance with Canadian accounting standards.
It provides clear financial data for decision-making.
Definition and Purpose
A chart of accounts (COA) is a list of all account names and numbers a Canadian business uses to record financial transactions.
Each account represents a category where you track money coming in and going out of your business.
The COA serves as your filing system for all financial activity.
When you make a business transaction, the chart tells you exactly where to record it in your general ledger.
This keeps your bookkeeping organized and accurate.
The main purpose is to categorize every dollar that flows through your business.
You can then see how much you earn from different sources and where you spend your money.
This organization makes it easier to prepare tax returns and meet Canada Revenue Agency requirements.
Your COA includes five main types of accounts: assets (what you own), liabilities (what you owe), equity (owner's interest), revenue (money earned), and expenses (money spent).
Each type serves a role in tracking your financial position.
Role in Canadian Accounting Systems
The COA acts as the foundation for all your financial reporting and bookkeeping activities in Canada.
Every transaction you record must fit into one of these accounts, which ensures consistency across your financial records.
Canadian businesses use the COA to maintain compliance with accounting standards and tax regulations.
The Canada Revenue Agency requires you to keep detailed records of your business transactions.
A properly structured COA makes this requirement easier to meet.
Your accounting software relies on the chart of accounts to generate reports automatically.
Whether you use QuickBooks, Sage, or another platform, the software uses your COA to categorize and report your financial data.
The chart also supports your internal controls by creating clear rules about how to record transactions.
This reduces errors and helps prevent fraud. When everyone follows the same system, your financial data stays accurate and reliable.
Connection to Financial Statements
Your chart of accounts directly feeds into the two main financial statements Canadian businesses need: the balance sheet and income statement.
The way you organize your COA determines how these reports look and what information they contain.
Balance sheet accounts include your assets, liabilities, and equity.
These accounts show your financial position at a specific point in time. For example, your cash account shows how much money you have in the bank on any date.
Income statement accounts cover your revenue and expenses.
These accounts track your business performance over a period of time, like a month or year.
They tell you whether you made a profit or loss during that period.
The COA ensures your financial statements follow Canadian accounting standards.
This consistency makes it easier for banks, investors, and other stakeholders to understand your financial position.
It also simplifies preparing year-end reports and tax filings.
Essential Account Categories and Structure
A chart of accounts in Canada follows five main categories that align with standard accounting principles and CRA requirements.
These categories create a hierarchy that separates balance sheet accounts from income statement accounts, ensuring proper financial reporting and tax compliance.
Assets, Liabilities, and Equity Accounts
These three account types form the foundation of your balance sheet.
They show your company's financial position at any point in time.
Asset accounts track everything your business owns that has value.
Organize these from most liquid to least liquid:
- Current Assets: Cash (1000), Accounts Receivable (1010), Inventory (1020), Prepaid Expenses (1030)
- Fixed Assets: Equipment (1040), Vehicles (1050), Buildings (1060)
Liability accounts record what you owe to others.
Structure these by payment timeline:
- Current Liabilities: Accounts Payable (2000), Credit Card Payable (2010), GST/HST Payable (2020)
- Long-term Liabilities: Business Loans (2030), Mortgage Payable (2040)
Equity accounts show ownership interest in your business:
- Owner's Equity (3000)
- Retained Earnings (3010)
- Common Stock (3020)
Number asset accounts starting with 1, liabilities with 2, and equity with 3.
This numbering system keeps your accounts organized and makes reporting easier.
Revenue and Expense Accounts
Revenue and expense accounts create your income statement.
They show how profitable your business is over a specific period.
Revenue accounts track all money coming into your business:
- Sales Revenue (4000)
- Service Revenue (4010)
- Interest Income (4020)
- Other Income (4030)
Start revenue account numbers with 4.
This makes it easy to identify income sources when reviewing reports.
Expense accounts record all costs you pay to run your business:
- Cost of Goods Sold (5000)
- Rent Expense (5010)
- Utilities Expense (5020)
- Payroll Expense (5030)
- Office Supplies (5040)
- Travel Expense (5050)
Expense accounts begin with 5.
Organize them by importance to your business operations.
For Canadian businesses, track specific expenses that matter for taxes.
This includes meals and entertainment, vehicle expenses, and home office costs.
Account Types and Hierarchies
Organize your chart of accounts using a clear hierarchy that supports financial reporting and business analysis.
Balance sheet accounts come first in your structure:
- Assets (1000-1999)
- Liabilities (2000-2999)
- Equity (3000-3999)
Income statement accounts follow after:
- Revenue (4000-4999)
- Expenses (5000-5999)
Within each main category, create subcategories using the second digit.
For example:
- 1000-1099: Current Assets
- 1100-1199: Fixed Assets
- 5000-5099: Cost of Sales
- 5100-5199: Operating Expenses
This numbering system lets you add new accounts without disrupting your existing structure.
You can insert account 1015 for "Allowance for Doubtful Accounts" between 1010 and 1020.
Keep similar accounts grouped together.
All payroll-related expenses stay in the 5300 range, while all utilities stay in the 5200 range.
Best Practices for Account Categories
Follow specific guidelines to keep your chart of accounts effective and compliant with Canadian requirements.
Keep it simple but complete. Include enough detail to track important business activities without unnecessary complexity.
A small business might need 50-75 accounts, while larger companies may need 200 or more.
Use consistent naming. Choose clear, descriptive names like "Office Rent Expense" instead of just "Rent."
This prevents confusion when categorizing transactions.
Plan for growth. Leave gaps in your numbering system so you can add new accounts later.
Using 1000, 1010, 1020 instead of 1001, 1002, 1003 gives you room to expand.
Track tax-deductible expenses separately. Canadian tax rules require specific tracking for:
- Meals and Entertainment (limited to 50% deduction)
- Vehicle Expenses
- Home Office Expenses
- Capital Cost Allowance items
Create separate accounts for these to make tax preparation easier.
Review and update regularly. Add new accounts when you start new business activities.
Delete accounts only at year-end to maintain proper audit trails.
Match industry standards. Use account names and structures that align with your industry practices and CRA expectations.
Building the Chart of Accounts Step by Step
Building your chart of accounts requires careful planning and attention to detail.
You'll establish relevant account categories, create a logical structure, assign proper numbering systems, and see practical examples for Canadian businesses.
Identifying Relevant Account Categories
Start by identifying the five main account categories that form the foundation of every chart of accounts.
These categories organize all financial transactions and feed directly into your financial statements.
Assets include everything your business owns that has value.
Cash, accounts receivable, inventory, equipment, and buildings fall into this category.
These accounts appear on your balance sheet.
Liabilities represent what your business owes to others.
Accounts payable, credit cards, loans, and GST/HST payable are common liability accounts.
These also appear on your balance sheet.
Equity shows the owner's stake in the business.
Owner's equity, retained earnings, and common stock belong here.
This category completes your balance sheet.
Revenue accounts track money coming into your business.
Sales revenue, service income, and interest income are typical revenue accounts.
These feed into your income statement.
Expenses record money going out of your business.
Rent, utilities, payroll, and office supplies are common expense accounts.
These also appear on your income statement.
Creating a Hierarchical Structure
Organize accounts in a hierarchical structure that moves from general to specific categories.
This structure makes your financial data easier to understand and analyze.
The main account categories sit at the top level.
Under each category, create subcategories that break down transactions into more specific groups.
For example, under Expenses, you might create subcategories like:
- Operating expenses
- Cost of goods sold
- Administrative expenses
Under Operating Expenses, get even more specific:
- Rent expense
- Utilities expense
- Insurance expense
This hierarchy lets you view financial information at different levels of detail.
You can see total expenses, operating expenses only, or drill down to specific expense types.
Assigning Account Numbers
We assign unique account numbers to each account in our chart of accounts. Account numbers organize our accounting system and help us find specific accounts quickly.
Canadian businesses usually use a four-digit numbering system:
- 1000-1999: Assets
- 2000-2999: Liabilities
- 3000-3999: Equity
- 4000-4999: Revenue
- 5000-5999: Expenses
We leave gaps between account numbers so we can add new accounts later. For example:
- 1000 - Cash
- 1010 - Accounts Receivable
- 1020 - Inventory
This spacing lets us insert new asset accounts without changing the existing structure. Some businesses use longer account numbers for more detailed categories.
Sample Chart of Accounts for Canadian Businesses
Here's a sample chart of accounts for a Canadian small business:
This structure provides a foundation for most Canadian businesses. We customize it to fit our industry and business needs.
Service businesses might add more service revenue accounts. Retail businesses need more inventory-related accounts.
Manufacturing companies require additional cost accounts.
Key Asset and Liability Accounts in Canada
Asset and liability accounts form the backbone of your Canadian business's balance sheet. These accounts track what your company owns and what you owe to creditors and suppliers.
Current Assets and Cash Accounts
Current assets are resources we expect to convert to cash within one year. These accounts help us track short-term financial health.
Cash accounts include your main business chequing account, savings accounts, and petty cash. Start numbering these with 1000 for your main operating account.
Inventory accounts track goods you plan to sell. Use account 1020 for raw materials and 1030 for finished goods if you manufacture products.
Prepaid expenses cover payments made in advance, such as insurance premiums or rent. Set up account 1040 to track these items that provide future value.
Fixed Assets and Depreciation
Fixed assets are long-term resources that help generate revenue over several years. We must track these assets for both tax and financial reporting.
Equipment and machinery need separate accounts starting with 1500. Use specific accounts for office equipment (1510), vehicles (1520), and manufacturing equipment (1530).
Accumulated depreciation accounts show the decline in asset value over time. Use negative account numbers like -1510 to offset your equipment accounts.
Track buildings and land separately since land doesn't depreciate. Use account 1600 for buildings and 1610 for land purchases.
We track depreciation annually for Canada Revenue Agency reporting. Depreciation affects both your balance sheet and income statement.
Current and Long-Term Liabilities
Liability accounts track money your business owes to others. Proper categorization helps manage cash flow and payment obligations.
Current liabilities are debts due within one year. Start these accounts with 2000 for better organization.
GST/HST payable (account 2100) tracks sales tax collected from customers. This account is essential for Canadian businesses registered for GST/HST.
Payroll liabilities include CPP, EI, and income tax deductions. Set up accounts 2200-2250 for different payroll obligations.
Long-term debt covers loans and mortgages due in more than one year. Use accounts starting with 2500 for these obligations.
Accounts Receivable and Payable
These accounts manage credit relationships with your customers and suppliers. They're important for businesses that don't operate on cash-only terms.
Accounts receivable (account 1100) tracks money customers owe you. Create sub-accounts for different customer types or aging periods.
Set up allowance for doubtful accounts (account 1150) to account for customers who might not pay.
Accounts payable (account 2000) records what you owe suppliers and vendors. This helps track payment due dates and manage cash flow.
Use separate payable accounts for different vendor types. Accounts 2010-2050 can track utilities, rent, and major suppliers.
Review and reconcile these accounts monthly to prevent errors and keep financial records accurate. Regular reviews help identify overdue accounts and payment priorities.
Revenue, Expense, and Equity Account Setup
We need careful planning to set up core account categories for business income, expenses, and ownership. These accounts capture daily transactions and long-term financial positions.
Income and Revenue Accounts
Revenue accounts track all money your business earns. Start with sales revenue as your main income account for product sales.
Create separate accounts for different income streams. Service revenue tracks money from consulting or other services. This separation shows which parts of your business earn the most.
Add other income accounts for non-core business earnings. Interest income tracks money from bank accounts or investments. Rental income captures payments from renting out space or equipment.
Use account numbers starting with 4000 for revenue accounts. Sales revenue might be 4000, service revenue 4010, and interest income 4020.
Group similar income sources together. If you have several service types, create sub-accounts like "consulting services" and "maintenance services" under your main service revenue category.
Operating and Non-Operating Expenses
Operating expenses include the cost of goods sold and daily business costs. Start with COGS as your first expense account if you sell products.
Create accounts for regular business costs. Salaries and wages need separate tracking from payroll taxes. This helps with tax reporting and budget planning.
Marketing expenses deserve their own account to track advertising costs. Office supplies, utilities, and rent each need individual accounts for better expense control.
Set up accrued expenses to track costs you owe but haven't paid yet. This includes unpaid bills and employee benefits.
Use the 5000 number series for expenses. Cost of goods sold starts at 5000, salaries at 5010, and marketing at 5020.
Group related expenses together. Put all payroll costs (salaries, wages, taxes, benefits) in the 5010-5050 range for easier reporting.
Equity Accounts and Retained Earnings
Equity accounts show ownership in your business. Common stock represents shares issued to owners in a corporation.
Retained earnings tracks profits kept in the business instead of paid to owners. This account grows when you make profit and shrinks when you pay dividends.
Set up owner's equity accounts for each business owner. In partnerships, create separate capital accounts for each partner's investment and withdrawals.
Use the 3000 number series for equity accounts. Owner's equity might be 3000, retained earnings 3010, and common stock 3020.
Keep equity accounts simple at first. Add more detailed tracking later as your business grows.
Tracking Office Supplies and Prepaid Expenses
Office supplies can be tracked as either an asset or expense account. If you buy supplies monthly, treat them as direct expenses.
Create a prepaid expenses asset account for large supply purchases. Move costs to expense accounts as you use the supplies.
Track prepaid insurance, rent, and software subscriptions in separate prepaid accounts. This improves control over cash flow timing.
Set up monthly processes to move prepaid amounts to expense accounts. This keeps your financial reports accurate each month.
Use account 1030 for prepaid expenses and 5040 for office supplies expenses. This separation shows both what you've paid ahead and current monthly costs.
Chart of Accounts Best Practices and Optimization Tips
Setting up your chart of accounts correctly from the start saves time and improves reporting accuracy. These practices help Canadian businesses create systems that grow with their needs and meet regulatory requirements.
Customizing Your Chart of Accounts
We design our chart of accounts to match our business needs, not just use generic templates. Most accounting software like QuickBooks provides standard templates, but these rarely fit every business perfectly.
Start with your industry requirements. Manufacturing companies need different expense categories than service businesses. Retail operations require inventory tracking that consultants don't need.
Keep account names clear and specific. Instead of "Office Expenses," use "Office Supplies" and "Office Equipment" as separate accounts. This makes financial analysis much easier later.
Plan for growth from day one. Leave gaps in your numbering system for future accounts. If you use 4010 for Sales Revenue, you can add 4020 for Service Revenue later without reorganizing everything.
Limit the number of accounts initially. Too many accounts create confusion and extra work. Add more accounts as your business grows and your reporting needs become more complex.
Leveraging Accounting Software
Modern accounting software helps us keep accurate records. It also lets us generate better financial reports.
We should choose software that fits our business size and needs.
QuickBooks Online works well for most small to medium Canadian businesses. It includes Canadian tax forms and supports multiple currencies.
Set up automation features to reduce manual data entry. Bank feeds import transactions automatically.
Recurring entries can handle regular bills and invoices.
Use account codes consistently. Most software allows custom numbering systems.
We should set up our numbering convention early and train all users to follow it.
Regular software updates help us stay compliant with Canadian tax rules. Cloud-based solutions usually handle updates automatically.
Generate monthly financial reports to monitor our financial performance. Consistent reporting helps us spot trends and make better decisions.
Maintaining Consistency and Scalability
Our chart of accounts needs clear rules that everyone follows. This keeps our financial data clean and reliable.
Create written procedures for categorizing transactions. Document which account to use for common expenses like meals, travel, and equipment.
Review accounts quarterly to find unused or duplicate accounts. Merge similar accounts to keep our system simple.
Train all users on proper account selection. When team members understand the system, we get more accurate financial data.
Plan for expansion by designing flexible account structures. If we operate in more than one location, we can add location codes to track performance by region.
Ensuring Compliance with Canadian Standards
Canadian businesses must follow specific accounting standards and tax rules. Our chart of accounts should help us meet these requirements.
Separate HST/GST accounts for each province where we operate. This approach makes tax filing simpler and reduces errors.
Track eligible business expenses in dedicated accounts. The Canada Revenue Agency has rules about meals, entertainment, and vehicle expenses that we must follow.
Maintain proper documentation for all account classifications. Clear records help us explain why we categorized expenses in certain accounts during CRA audits.
Use Canadian dollar as our base currency even if we work with international customers. Our accounting software uses multi-currency features to handle conversions and keep CAD records.
CRA Updates That Affect Your Chart of Accounts
Canadian accounting requirements continue to evolve. Here is what has changed or been reinforced in 2025 that directly affects how you should structure your chart of accounts.
CRA's Digital Record-Keeping Expectations
CRA has reinforced its expectation that all businesses and registered charities maintain digital records that support a clean, traceable audit trail. Your chart of accounts must be structured so that every transaction can be traced from your bank records through to your financial statements and tax returns without gaps or manual reclassification. This means account names should be clear, accounts should not be overloaded with mixed transaction types, and your COA should be stable enough from year to year that CRA can compare filings across periods.
T3010 Alignment for Registered Charities
If you are a registered charity, your expense accounts should map directly to the three T3010 expenditure categories: Charitable Programs, Management and General, and Fundraising. Setting up your COA with this alignment from the start means your accountant can pull figures directly from your accounting software at year-end without having to manually sort through transactions. It also reduces the risk of errors or inconsistencies in your T3010 filing, which is one of the most common triggers for a CRA review of a registered charity.
Accounting Software Updates in 2025
If you use QuickBooks Online, Sage, or Wave for Canadian accounting, verify that your COA account mappings are still correct after any 2025 software updates. Canadian tax table updates and changes to GST/HST account defaults can sometimes reset or remap existing accounts. Before your next filing period, confirm that your GST/HST Payable, payroll liability, and income accounts are still correctly mapped to your chart of accounts.
Provincial Sales Tax Accounts
Organizations operating in multiple provinces should maintain separate provincial sales tax accounts where applicable. Quebec's QST, Saskatchewan's PST, and British Columbia's PST each have different rules for registration, reporting, and remittance. Your COA should have individual accounts for each tax type so remittances can be tracked and reconciled separately from your federal GST/HST accounts.
Conclusion
Setting up a clear, well-structured chart of accounts is one of the smartest moves you can make for your Canadian business or nonprofit. Focus on simplicity: use logical numbering, straightforward account names, and stick to a consistent method. With today’s cloud accounting tools, keeping your accounts organised—and avoiding errors—has never been easier.
Stay consistent each year and involve your leadership team so everyone’s on the same page. Try not to make things more complicated than they need to be. As your organisation grows, your chart of accounts should evolve with you, always following Canadian accounting standards.
If you need help building or reviewing your chart of accounts, the team at Charity Accounting Firm is here for you. We understand the ins and outs of Canadian accounting and can support you at every step.
Frequently Asked Questions
These common questions cover the chart of accounts setup procedures, numbering systems, and the different types of accounts Canadian businesses use. We also address changes in the accounting profession and specific requirements for Canadian tax compliance.
What is the future of accounting in Canada?
Canadian accounting is moving toward automation and cloud-based systems. The CRA requires accurate digital records and standardized account structures. AI helps with transaction categorization, but professional oversight remains essential for compliance.
How to properly set up a chart of accounts?
Start with five account types: assets, liabilities, equity, revenue, and expenses. Use four-digit numbering with 1000-1999 for assets, 2000-2999 for liabilities, 3000-3999 for equity, 4000-4999 for revenue, and 5000-9999 for expenses. Use specific names like "Office Supplies" instead of vague terms.
How many types of accounts are there in Canada?
Canadian businesses use five main types: assets, liabilities, equity, revenue, and expenses. Assets and liabilities are split into current and long-term categories. Current items convert to cash or come due within one year.
What is the best practice for chart of accounts numbering?
Use a consistent four-digit system with standard ranges for each account type. Leave gaps between numbers for future expansion and keep the same system across all locations. Avoid changing numbers frequently.
What are all the registered accounts in Canada?
Tax-sheltered accounts include RRSPs, TFSAs, RESPs, RDSPs, and FHSAs. Business accounts include GST/HST, payroll, and corporate income tax accounts. Professional licensing and provincial registration create additional account requirements.
What is a CRA account in Canada?
A CRA account is your business registration with the Canada Revenue Agency using a nine-digit Business Number. You register when starting a business, creating tax filing obligations. Access it online through My Business Account for returns and payments.


Follow Us

